


Understanding the Concept of Leverage & Position
Have you ever wondered how some people make a lot of money from crypto trading, even when the market isn’t moving much? They’re often using the two most powerful tools available at your disposal – leverage and a clear position.
Let’s break down these concepts in a simple way, without all the confusing jargons, and by the way, you’d notice that every single crypto jargon is linked to its simple explanation at our Zen Wiki, so feel free to read the detailed meanings, in case you don’t understand it during the flow of this post.
What is a “Position”?
In the world of trading, a “position” is just a fancy way of saying you have an open trade. There are two main types of positions:
- Long Position (Going “Long”): This is the most common one. When you go long, you are betting that the price of an asset (like Bitcoin or Ethereum) will go up. You buy the asset now, hoping to sell it for a higher price later. For example, looking at the recent rally, and overall bullish market sentiment, ETH is expected to cross it’s recent all time high of 4300 again, and break past its previous all time high 4721.07 on Nov 12, 2021, so you’re hoping that it’ll go back up from current value of 4227, but probably after a few cycles of ups and downs, and a bit of sideway movement.
- Real World Analogy: Think of it as a simple example – you buy a t-shirt for $10, hoping to sell it to someone else for $12. Your “position” is that you own the t-shirt, and you are “long” on its price. If the price does down to $9, you’ll incur a loss, and if it hits the target price of $12, you make a profit of $2.
- Short Position (Going “Short”): This is the opposite. When you go short, you are betting that the price of an asset will go down. This might sound strange, but it’s a very common strategy. You borrow an asset, sell it at the current high price, and then buy it back later at a lower price to return it to the person you borrowed from. The difference is your profit.
-
- In the same ETH/USDT trade example, if you see that it’ll dip slightly from 4225 to say 4203, you open a short position to cash in, and then open a long position again from 4205 to 4299
- Real World Analogy: You borrow a friend’s t-shirt and immediately sell it for $10. The next week, the t-shirt goes on sale for $7. You buy the same t-shirt back for $7 and give it to your friend. You’ve just made a profit of $3! You were “short” on the t-shirt’s price.
And, the best part is that you can constantly keep doing it over and over again, and keep making shitloads of money, by following the market cycles, but once again, it’s important to set target price, and stop losses, otherwise you’re merely gambling, and you’ll ultimately end up losing money, even if you win a few times with a bit of luck.
With current crypto market trading over 4 Trillion in total value, an immediate crash was imminent, so I opened short positions for almost everything, ETH, BTC, IMX, and made easy money – here’s an easy example of opening a “short position from 4365 to 4301, with 8x leverage, $1000 position size, 10x Leverage and $100 Margin on Mexc.com
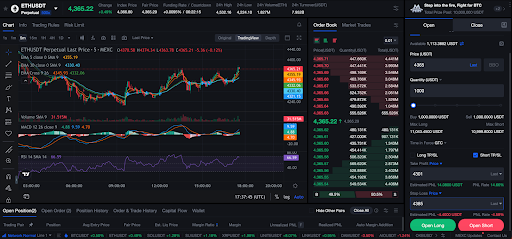
Disclaimer: This is just an example, please don’t open a “short trade” at these values – you must learn the fundamentals first, master the art of chart reading, and do a lot of paper trades on demo account, and then start your crypto futures trading journey
What is “Leverage”?
This is where things get interesting. Leverage is the act of using borrowed money to increase your trading position. It’s a way to magnify both your potential profits and your potential losses.
- Think of it like a magnifying glass: A magnifying glass can make a small object look much bigger. In the same way, leverage can make your small investment “bigger” by using a loan from the exchange for a short duration (i.e. duration of your trade)
- The “10x” or “5x” Thing: You’ll often see leverage described with a number like “10x” (ten times) or “20x.” but don’t get confused, i’ll try to explain this in layman’s terms again.
Real World Scenario: You only have $1000, but you want to do a trade of $20,000 for few hours, so what do you do? You’re pledging this $1000 as a security – so essentially you’re doing a trade worth 20 times the money you actually have – this means you’re using 20x leverage.
Here’s how leverage works in practice:

Let’s say you want to go long on Bitcoin. The price is $110,000
- No Leverage: You invest $1000 of your own money. If the price of Bitcoin goes up by 10% to $121,000, your $1000 investment becomes $1100. You made a profit of $100 (10%).
- With 20x Leverage: You invest the same $1,000 of your own money, but the exchange lends you $20,000. Now, your total position is worth $20,000. If the price of Bitcoin goes up by 10% to $121,000, your $20,000 position is now worth $22,000. After you pay back the $20,000 you borrowed, you are left with $2,000. You’ve made a profit of $2000 (200% return on your original investment)!
But wait, there’s a huge catch! Leverage is a double-edged sword.
What happens if the price goes down instead of up?
- With 20x Leverage: Your $20,000 position loses 5% and is now worth $19,000, but since you have to pay back the $20,000 you borrowed, you are left with nothing, and your entire original investment of $1000 is gone. This is called a liquidation. Your position is automatically closed by the exchange to prevent you from owing them money.
In a Nutshell
- Position: Your bet on an asset’s price movement.
- Long: Bet the price will go up.
- Short: Bet the price will go down.
- Leverage: Using borrowed money to increase your position size. It amplifies your profits but also your losses.
Leverage can be a powerful tool for experienced traders, but it is extremely risky. It’s the primary reason why many new traders lose their money quickly. As a total beginner, it’s always best to start trading without any leverage at all, until you truly understand the risks.
Chart Reading and Indicator Analysis:
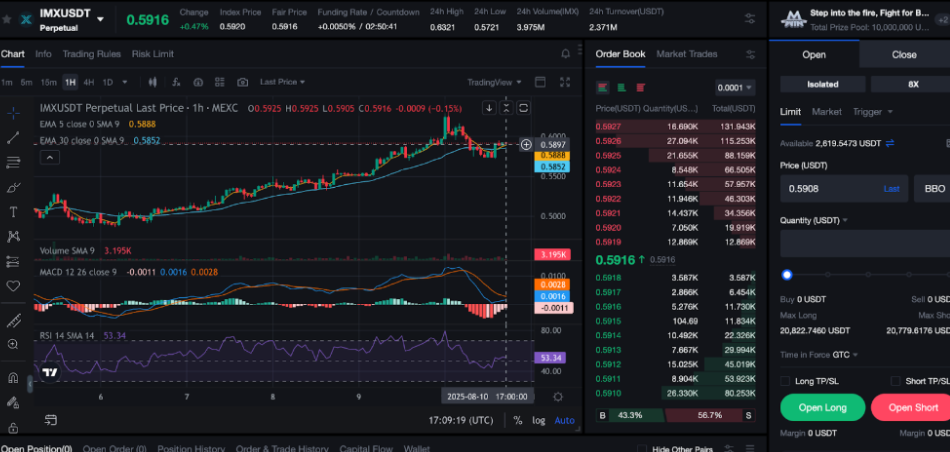
- Current Price: The price is at approximately 0.5916, which is a decline from a recent peak.
- Price Action: The price has recently failed to break above the 0.62 level and is showing signs of a reversal or a pullback. The price has dropped below the 5-period and 9-period Exponential Moving Averages (EMAs), which can be a bearish signal in the short term.
- RSI (Relative Strength Index): The RSI is at 53.34. This is a neutral level, meaning the asset is neither overbought nor oversold. It suggests that there is no strong momentum in either direction, and there is room for the price to move up or down before hitting extreme levels. It does not provide a strong signal for a short position on its own, but it doesn’t contradict a bearish thesis either.
- MACD (Moving Average Convergence Divergence): The MACD lines have recently crossed over in a bearish direction. The MACD line (the blue line) has crossed below the signal line (the orange line), and both are below the zero line. This is typically considered a bearish signal, suggesting that the short-term momentum is shifting to the downside. The histogram bars are also turning red, which reinforces this bearish momentum.
Analysis of this Strategy:
This proposed strategy of opening a small short position down to the 0.5751 level, just above the previous support, aligns with the bearish signals from the MACD.
- Bearish Signal from MACD: The MACD crossover provides a strong technical reason to anticipate a short-term price decline.
- Target Level: The target of 0.5751 is a logical one. It’s just above a previous support level, which is a common place to set profit targets for a short trade. This provides a safety buffer in case the price bounces off the support.
- RSI as a Neutral Factor: The RSI at 54 doesn’t give a strong signal either way, but it also doesn’t contradict your short thesis. The price has room to fall before becoming oversold.
Potential Risks and Counter-Arguments:
- Support Level: The price is still above a key support zone. While your target is just above this, a strong bounce from this area could stop out the trade.
- Market Volatility: The crypto market is highly volatile, and a sudden change in sentiment or a significant buy order could quickly reverse the current trend, regardless of the indicator signals.
- EMA Crossover: The 5-period EMA and 9-period EMA are still relatively close to the price and haven’t fully confirmed a strong downtrend. They could cross back over, signaling a reversal of the current pullback.
In summary, this technical analysis seems to be based on the bearish MACD crossover and a well-defined support level. The current price action and the position of the EMAs also support a potential short-term decline. However, the neutral RSI suggests the overall trend is not yet strongly bearish, so caution is warranted.
Safer Play Alternatives
Now, an alternative entry and exit points I could consider, with a focus on risk management and different potential scenarios.
Disclaimer: This is for educational purposes and is not a recommendation to trade. Technical analysis is not a guarantee of future price movements, and please don’t enter a similar position as the market doesn’t behave the same way – I’ve opened this short after a recent strong rally, expecting a normall pullback, and making a couple hundred bucks in the process, with tight stop losses.
Scenario 1: A More Conservative Short Position
This strategy waits for a stronger bearish confirmation before entering the trade.
- Entry Point (Short): Instead of entering at the current price of 0.5916, a more conservative entry would be to wait for the price to break decisively below the key short-term support level which appears to be around 0.5852 (the level of the 5 EMA and 9 EMA). A strong close below this level would confirm that the short-term bullish momentum has completely failed.
- Target (Take Profit): The previous support level is at approximately 0.5751, which is a good initial target. A more ambitious target could be the previous low at around 0.5650, but this carries more risk.
- Stop Loss: A logical stop-loss would be placed just above a recent resistance level, perhaps around 0.5950 or even above the recent local high at 0.6000. This would protect against a failed breakdown and a quick reversal.
Rationale: This approach avoids the potential for a fake breakdown and ensures a clearer trend is established before committing to the trade.
Scenario 2: A Bullish Counter-Trend Reversal
This strategy assumes the current decline is just a temporary pullback and that the price will continue its broader upward trend. This is a higher-risk strategy and contradicts the current MACD signal.
- Entry Point (Long): The ideal entry would be to wait for the price to bounce convincingly off a strong support level. A key support level appears to be around 0.5751. An entry here would be based on the belief that this level will hold.
- Confirmation: A long position should not be opened until there is a clear bullish signal, such as a bullish engulfing candle or a reversal candlestick pattern forming at the support level. The MACD would ideally start to curl upwards and show signs of a bullish crossover.
- Target (Take Profit): A logical target for this trade would be the recent local high at around 0.6000 or the more significant resistance level at 0.6200.
- Stop Loss: A stop loss should be placed just below the support level at 0.5700 to protect against a breakdown.
Rationale: This strategy is for traders who believe the overall trend is still bullish and see the current drop as a good buying opportunity.
Scenario 3: A Continuation of the Existing Downtrend
This strategy focuses on riding the existing bearish momentum from the recent peak.
- Entry Point (Short): The current price around 0.5916 is a valid entry point, as it’s below the short-term EMAs and the MACD has just crossed over. This is similar to your original idea.
- Target (Take Profit): Instead of a single target, a trader could use a trailing stop loss or a partial profit-taking strategy. For instance, take 50% of the profit at the previous support of 0.5751 and let the rest run, with a trailing stop-loss to protect the remaining profit.
- Stop Loss: A tight stop loss could be placed at the recent local high of the current bearish candle, for example, around 0.5930. This minimizes the potential loss but is more susceptible to being “wicked out” by a quick price spike.
Rationale: This strategy seeks to capitalize on the immediate bearish signal from the MACD and the price’s failure to maintain its recent high. The trailing stop allows for the capture of a larger move if the downtrend accelerates.
Each of these scenarios is based on different risk appetites and market assumptions. The best strategy depends on your personal trading style and confidence in the signals.
3 Comments
This article really simplified leverage for me! The t-shirt analogy made the long and short positions so much clearer.
I’ve been trading on demo accounts for months, and leverage always felt intimidating. After reading this, I finally get how powerful (and risky) it is.
Loved the examples with ETH. Seeing both the long and short scenarios side by side hit me.